Shreveport Louisiana finally has Live Web "haze" Cams!
Well, they're not officially "haze" cams, but they'll work won't they because now at last we can see how crappy the sky usually looks in central Shreveport, thank in large part to the existance of Texas (which if absent would allow the same % sunshine and air quality of West Texas) with over 23 million in population (compared to just over 4 million in Louisiana). 23million is just shy of the entire population of LA,OK,AR,MS,AL, and TN combined ! All 23 million geographically focused just upwind (by usual jet stream Westerly direction) of us here in LA. In fact many EPA pm2.5 soot monitors in Dallas particularly SE of the city show lower average annual levels than Shreveport itself (9ug's compared to 13ug's)!
Below is a map that shows the point sources of non-road pm2.5 in our area as well as the tons of pm2.5 "soot" produced. There are over 30 coal-fired power plants in TX (we have only 3 or 4 in LA) and there are 4 just West of Shreveport all within about 60 miles that emit more mercury into the air than (according to a Texas news article) any other source in all of Canada, North and South America. Nearly 4,000. pounds of it per year. That's about 11 pounds per day, and it only takes 1/70 of a teaspoon of mercury to give a small lake a Mercury fish advisory. The Texas Bass fisherman association president once remarked that we really need to do something about it, that is was a shame that most folks can't eat the fish from our local waters. In case you haven't realized it yet....when it rains, as the EPA states, it's a "Washout" and the particles are rinsed from the air onto the ground and waters. Nearly every body of water in NW LA has a Mercury fish advisory. The Sulfates and Nitrates that are emitted by auto and diesel sources as well as from factory and coal-fired energy plants are also washed-out onto the ground....into our water supplies, our food chain, and are primarily responsible for the acid rain problems and resultant deforestation seen in some areas of the Eastern US. Rain collection studies have shown that the average ph of the rain water in our area is now about 4.5 ! Neutral is 7.0 and Coca Cola is about 4.2 (which will eat paint from a car and dissolve extracted teeth in about 2 weeks).
click on photos to enlarge


Look at what we naturally would be drinking, stream water at 6-8 range. Most bottled waters i've tested are no higher than 5.0
When pm2.5 levels are up we may be breathing air laden with moisture at a ph of 1 or 2, nearly that of battery acid !
We breathe nearly 6,000 liters of this air a day and considering that new research is showing that human systemic Acidotic conditions are leading to a record number of reactive hypercalcemia disorders such as calcified arteries, arthritis, arrythmias, osteoporosis and others, which is course primarily due to the acidity of the typical American diet, but this may be a contributor when you consider the heart disease patterns and relationship to polluted areas of the US. The lowest heart disease in the US (MN,MT,ND,SD,WY) are areas of normal to high comparative steak and cheese consumption, but are areas of best air quality, highest routine winds causing less local buildup, and lower population densities. More Here. BTW, a vegetarian diet is very alkaline (sans cheese) and the longest lived people in the world, the Okinawans (island south of Japan), with over 36% of the population over 100 yrs old, eat a very alkaline; fish (low acid) and vegetable based diet (with almost NO animal meats or fats such as cheese and butter). They are also blessed with good air by the way. More on this later. During very sooty high pm2.5 days the ph of the humidity in our air can get down to the 3's which means we are inhaling moisture more acidic than coca cola!
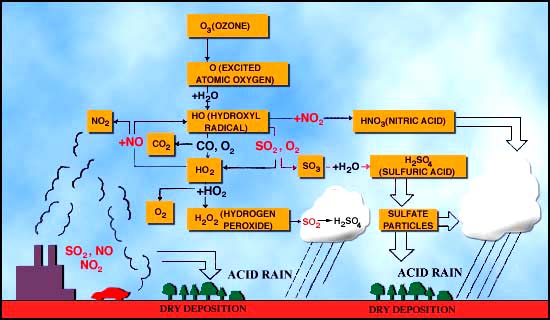
Acid Rain cycle:
Here's the Shreveport webcam image for today:
Two different Cam Links here: http://www.opentopia.com/showcam.php?id=3506&time=1204300405
and here:
http://www.ci.shreveport.la.us/LiveCam/LiveCam.htm
Shreveport. Humidity about 70%.

Compared to other areas around the US today, same time of day
mind you, all of which goes along with the AOD aerosol optical
depth map of the US today showing bright red high AOD under the
clouds over SE US:

Boise Idaho Humidity~70% (humidity history from Accuweather.com)

Richfield Utah Humidity ~70%

Denver, CO Hum~40%

Washington DC (typical haze level). Humidity was about 44%.

Houston, TX Humidity ~ 55% same time of day as above camshots.

Other related maps:
Notice the bad spot just west of Shreveport because of coal plants I
mentioned above: Click photo to enlarge.


Sulfate depostion goes hand in hand with Nitrates which are
both largely responsible for the low ph acid rain (and water
vapor in the air you breathe). The ideal blood and brain ph is
6.8 - 7.4.
From the EPA: Click to enlarge.

Environment Canada statement on Acid Rain and its causes:
http://www.ec.gc.ca/acidrain/acidfact.html
A USGS.GOV article on Acid Raid, Washington DC levels
and sources here. excerpt:
""Clean" or unpolluted rain has a slightly acidic pH of 5.6,
because carbon dioxide and water in the air react together
to form carbonic acid, a weak acid. Around Washington,
D.C., however, the average rain pH is between 4.2 and 4.4.
The extra acidity in rain comes from the reaction of air
pollutants, primarily sulfur oxides and nitrogen oxides, with
water in the air to form strong acids (like sulfuric and nitric
acid). The main sources of these pollutants are vehicles and
industrial and power-generating plants. In Washington, the
main local sources are cars, trucks, and buses.
..This pattern of high acidity is caused by the large number of
cities, the dense population, and the concentration of power and
industrial plants in the Northeast. In addition, the prevailing
wind direction brings storms and pollution to the Northeast...""

Another articles on Acid Rain damage here.

Deforestation from our cars, trucks and "dirty" unregulated
Electric Utilities. Please, buy a Hybrid or at least a SULEV rated
vehicle !! Email your government to require your local electric
utilities to install freely available filtration devices. There is only 1 or 2 coal fired power plants East of Dallas Ft Worth (upwind by jet stream), and a handful in progressive states such as Colorado, but you can bet they have filtration because they only emit a fraction of the mercury as "our" upwind plants here in the ArkLaTex (20-50 pounds per year compared to 2,000. pounds from a plant in Titus county in Texas).


attorney R.F.Kennedy Jr's book Crimes Against Nature
details how the Bush administration has rolled back decades of
industry regulation aimed at curtailing these emissions.
Many if not most of Bush choices for the highest posts in
government environmental protection were past oil, gas,
auto and other industry cronies that spent most of their lives
working to deregulate environmental protection !!
 Satellite view of clouds and associated Haze (pm2.5, Nitrates,
Sulfates, mercury, Volatile Organic Compounds such as
Benzene, arsenic.... you name it....hundreds of toxins which
when you are within a 1/2 mile of an interstate can reach
concentrations of over 120,000 (micron and nanometer sized)
particles per cubic centimeter of air. They are measurable
within you blood stream within an hour of inhalation, and studies
show that in cities with higher pm2.5 levels, the C-reactive
protein marker for systemic human inflamation that leads to arterio-
vascular diseases such as heart attack and stroke, are found
to be higher as measured in health screening blood tests.

If acidic rain and moisture in the air can damage the Gargoyles
and other structures,
imagine what it can do at the cellular level to us, once
we lose the ability to buffer environmental acidity from chronic
calcium deplection. Our bodies primarily use calcium to bind
or buffer (neutrilize) acid compounds in our diet and from
inhalation. Americans consumes more calcium supplements than
any other country, and yet has one of the highest rates of
osteoporosis in the world, and it's proven that our diet is among
THE most acidic in the world. Go figure. Personally I follow
a mostly vegetable and fruit based Alkaline diet for common
sense reasons, with some lean grass-fed meat (more alkaline
meat and fats than corn fed commercial meat) and Alaskan
wild-caught sockeye salmon, tofu, and eggs for protein.
I measure my urine ph daily, and aim for a prescribed 6.9-7.5
range. On very high pm2.5 hazy humid cloudy days I find
it much harder to maintain this ph with a similar diet to what
I usually consume on a clear clean air day. Anecdotal but true.
On the bad days I have to really up the alkaline foods to stay
in balance. If I don't, I can get down in the 5.5 - 6.0 range
accompanied by burning tears and urine: Acid-dumping.
This is a logarithmic scale, meaning that 6.5 is 10 times more
acidic than the ideal 7.5, and 5.5 is 100 times more acidic.
The moisture in the air can hit lows of ph 1.0 which as the
ph diagram above shows, is the ph of battery acid !!
In the dental field, it has now been shown that acid diets
(and air ?) cause hypercalcemia and increased excretion of
acid-calcium compounds in urine and saliva, leading to
calcification of plaque on teeth....which is what calculus or
tartar is. Vegetarians may not form tartar! We can advise a
patient with calculus and a family history of heart disease that
if they are getting calcification of their plaque on their teeth,
the same may be happening in their arteries.
One of the newest high tech methods for determining the
degree of atherosclerosis is the EBCT (electron beam comp-
uterized tomography) which is considered more accurate than
most other common methods, and takes about ~3 mm sliced images of
the heart, that allow doctors to give you a Calcium Score which
is directly correlated with the degree of calcified blockages. Our fatty
arterial plaque is being Calcified from chronic hypercalcemia from
acidic meat, cheese, dairy, and sugar based diets !! And remember
that vegetarians pretty much don't get heart disease. Hmmm.
Of course studies have shown that pm2.5 toxins do direct damage
to the endothelial cells lining the vessels.
Could it be that atmospheric acidity makes it more difficult for
us to stay at the correct ph, and this is why we see greater
heart disease in the areas with highest acid rain ??
Gorillas, by the way (all blood type B), which are now proven to be just as related or more so than chimpanzee's to humans, both at 98.6 % similarity as confirmed by the recent completion of the chimpanzee and gorilla's entire genome, are 3-600 pound vegetarians. Heart disease among them in the wild is uknown, except that now the ones in captivity in high pm2.5 cities, ARE getting it, and dying from it. Gorillas in parks in Cleveland and DC have heart disease, and have died from heart problems !! Wow. A study needs to be done on average longevity in different parks around the world to see if there is a pm2.5 connection for them. I'm sure there is, since there is such a high correlation among humans. See "pm2.5 and heart disease" google search here. Excerpts on Gorilla dying of heart disease in US large city:
""These gorillas seem to develop heart disease," said Frist (R-Tenn.). "It's totally unknown. I did a lit search -- nothing. The fact that we're working on the edge of the unknown is fun."
http://www.washingtonpost.com/wp-dyn/content/article/2006/05/23/AR2006052301380.html
"Now heart disease is common among captive gorillas. Really common. Scanning the literature, I've found research on gorilla hypertension diagnosis and treatment, irregular heart beats, swollen and malfunctioning heart muscles. Which is all pretty interesting..seeing as heart disease is one of the most common killers of people. Causes of mortality for gorillas in the wild are hard to ascertain (especially as there, like, aren't hardly any western lowland gorillas LEFT in the wild), but heart disease isn't likely to be one of them. In fact, doctors in 1997 wrote a paper on how the gorilla diet (mostly plants, fruits and lots of roughage) could be a model for healthy people diet. The authors suggest that because humans likely evolved eating this kind of stuff, it might be really healthy for us." http://www.inkycircus.com/jargon/2006/07/gorillas_n_hear.html
Matt Lauer on same.
Heart Disease Death Rates: Note that out West it's the areas
DOWNWIND of the larger cities that have the highest level.

Additional links:
http://www.birds.cornell.edu/Publications/Birdscope/Autumn2002/wood_thrush.html
posted by countryboysworld @ 10:37 AM
0 comments
![]()
![]()


