Trend of Poor Air Quality Continues in NW Louisiana.
Click on all images to enlarge:
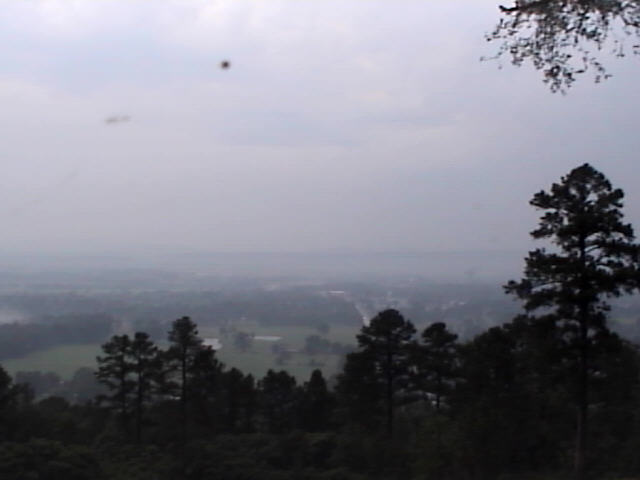
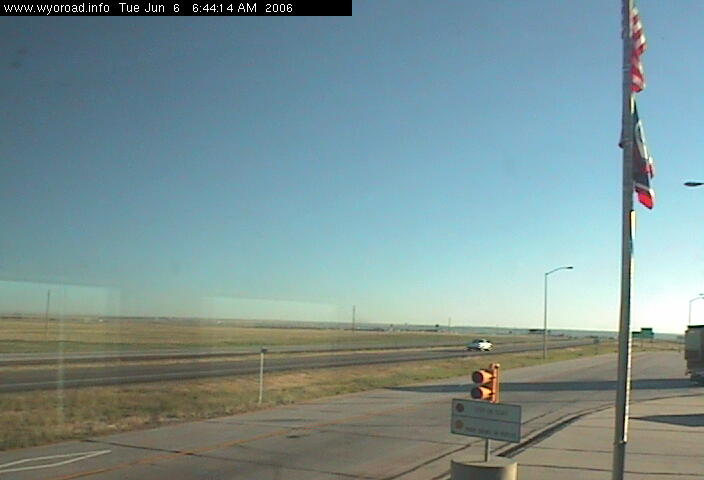
To continue with yesterday's post, here's the bad: Danville, Arkansas seen above, very nasty, and which as you can see in the Humidity map of yesterday morning has the about the same humidity level as Houston, Burlington Vermont and Cheyenne Wyoming (cam images of these cities are below-in order) yet VASTLY DIFFERENT AIR POLLUTION LEVELS ! It's informative to watch an "animation" cam of images from a polluted area like Danville to see the crud blow in and out throughout the day (click here for Danville: past two days).

Houston, TX
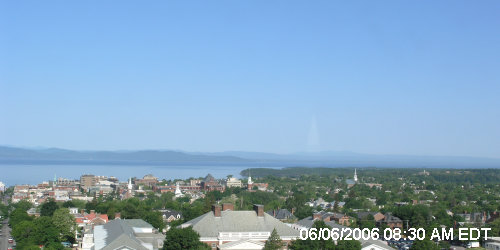
Burlington, Vermont

Cheyenne, Wyoming
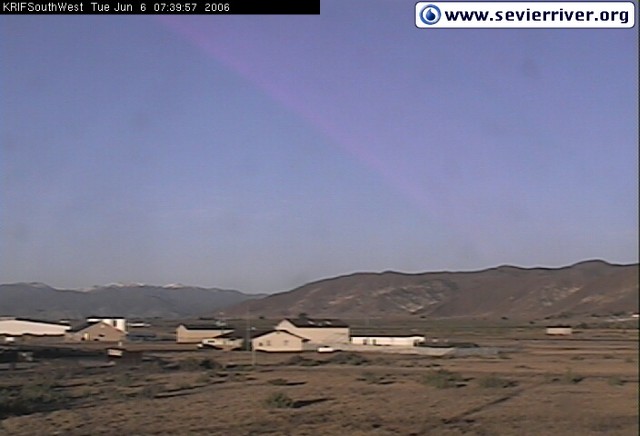
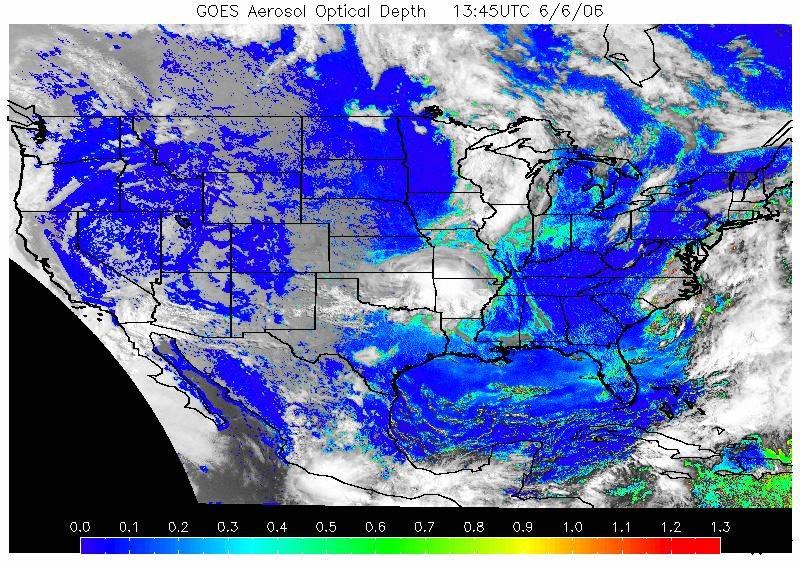
There's a Big Difference in Haze levels from these images and those of the Smokies and Utah, as one would expect from the GASP image of yesterday morning. Once again this brown or sometimes greyish white haze visible in the horizon is NOT Humidity!!!!
As mentioned before, please click LOOP and/or > below the photo on the right at this site to see what an increase in haze and air pollution does to the visibility and beauty of our once magnificant landscape. Best viewed with Netscape browser for animation to work. Here in the Eastern US visibility has been reduced to about a 10 km average, whereas it would "naturally" be as good as 100km's.....about as nice as an average day in Colorado looks like.
This haze is also visible in this satellite image from aviationweather.gov where you can get near live satellite images of haze and soot in your area of the US (click on image or loop, then on your nearest area of the map). Here it is:
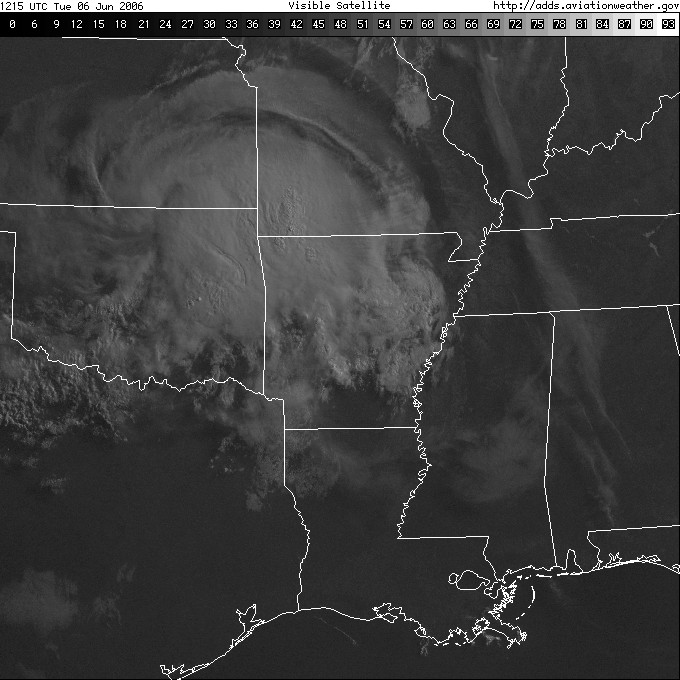
Click on image.
It's important to compare this with the GASP pollution image linked to above to see that where there is cloudiness there is usually poor air quality (unless it is raining or misting, which is what the EPA terms a wash-out...that "rinses" the air clean of particles and into our streams, lakes and rivers....which is why most bodies of water in the US have Mercury fish advisories or are unsuitable for life and if there IS something alive in your neighborhood stream or pond, you probably wouldn't want to eat it!).
The reason that there is often clouds or fog over polluted air is that the particles in the air act as "seeds" to allow the water vapor to condense together to form larger water particles or moisture that makes up clouds. Remember in the old days how they would "seed" clouds with particles or chemicals spewed out of airplanes to make them supersaturated and finally precipitate to rain forth over the dry midwest agricultural plains? Now they don't need that, what with the plentiful pollution "seeding" from Asia and our large west coast cities doing it now. I've seen moisture laden air (65%+RH) come in from off the Pacific ocean, flow over California and stay clear of cloud formation except for the sections of the airmass that flows over the larger cities such as Los Angeles and San Francisco, which clouds will then fan out from all the way out over multiple states. Please no one tell W about this as he'll think more polluting cars and coal plants will provide much needed rain in our nations heartland. If Asia did not exist, or there were no people there, our NW neighbors in Seattle and nearby would have weather as nice and sunny clean as the folks down under in Australia! Correct me, if I'm wrong, Dr. Husar.
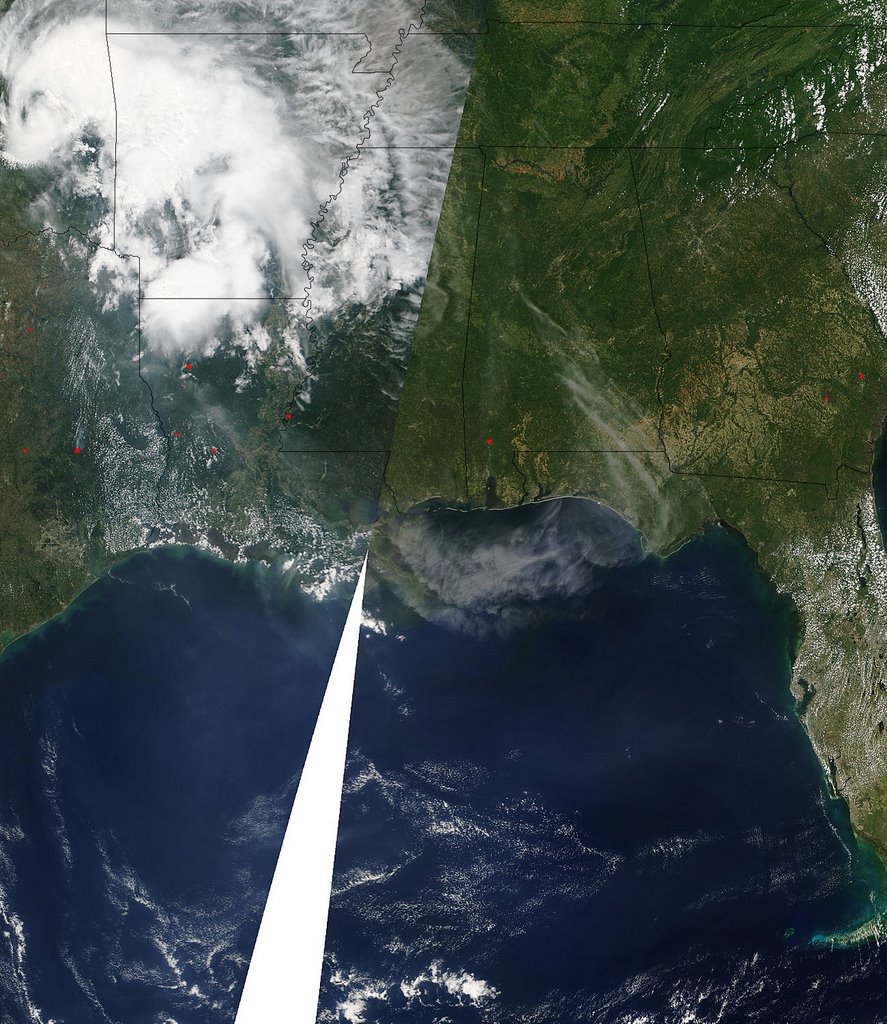
Another excellent image is this NASA MODIS twice-daily satellite "photograph" taken throughout the world that also shows clearly the difference between haze/air pollution and clouds. On the page scroll down a bit...Click on a red square surrounding your area, choose a resolution (250M being the highest resolution image that shows the haze best). Here is the MODIS image from yesterday morning:
This is the medium resolution image, to see the high res version, click here.
In later posts I will show examples of how this crud accumulates from local sources and can travel from one end of the country to the other. Also, when winds are very lite or non-existant, i'll demonstrate how a perfectly clean clear feel-good blue skie day can turn into a nasty hazy headachey day from an accumulation once again of local pollution. On a bad day it's like running your lawnmower in your house for an hour or two and then hanging out in that smoke.
It's easy to see that this is smoke or soot from the 30+ coal burning energy plants and 10-15 million cars and trucks running around this area every day (and sometimes fires in the area, or from Asia [which i'll prove in a later post]). Each auto or truck puts out billions of nanometer sized particles classified by the EPA as PM2.5 micron and under sized particles, that you cannot see as they exit the tail pipe, but seen through the distance, they are visible as smoke or haze.....the main reason why if you live within 100 meters of an interstate or busy road you are three times more likely to get leukemia (cancer) than the averge US citizen... see Scorecard.org and the EPA partner:Health Effects Institute site for more. Much more on this later....
Here's the forecast for the coming days: AirNow forecast. Click on the map to enlarge.
Also: todays last GASP image showing high levels across the SE.
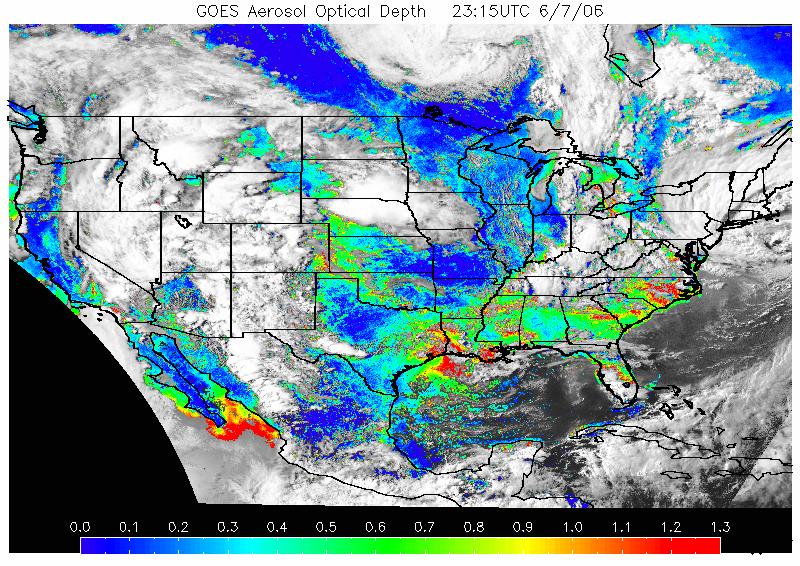
The white areas are clouds or fog, and this Aerosol and Smoke image captures all particles, even from fires ,and sometimes it's just good ole natural pollen.
To see where this crud will head tomorrow, check out the projected path of pollutants at this animation.
posted by countryboysworld @ 6:39 PM
0 comments
![]()
![]()

0 Comments:
Post a Comment
<< Home